Particle image analysis – shaping up to the future
From diamond abrasives to the perfect glass of whisky – there is a lot riding on particle image analysis. Here, Graham Rideal keeps us in the picture with this rapidly developing technology
From diamond abrasives to the perfect glass of whisky – there is a lot riding on particle image analysis. Here, Graham Rideal keeps us in the picture with this rapidly developing technology
| |
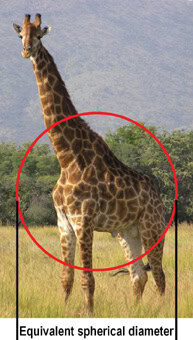
| Figure 1. The equivalent spherical diameter is not a useful measure of 3- dimensional shapes |
The equivalent spherical diameter of the human body is not that informative, and more vital statistics give a better impression of size. Similarly, weight alone as a guide to obesity is not a good definition and shape (height) must be brought into the equation in the form of the Body Mass Index, figure 1.
Likewise, in particle metrology, a measure of particle shape can be much more descriptive, and has answered many unresolved anomalies in the past - such as powder flow, solubility and catalytic performance.
Particle shape is therefore being increasingly recognised as an important parameter and enormous technological developments have been made in recent years. These include advances in microscope and lens design coupled with increased computer power and the development of high performance digital cameras. It is now possible to capture, process and store images at hitherto unimaginable speeds.
Most of the major players in the field of particle size analysis now offer devices for particle image analysis.
Viewing individual particles is the only absolute method of assessing particle shape and microscopy is traditionally the tool for the job. Counting fibres and measuring their length to thickness ratio (the aspect ratio) has been extremely important in the asbestos industry but manually counting and measuring sufficient particles to obtain statistically valid results has taken up to 8 hours to perform. A similar analysis today would take just a few minutes.
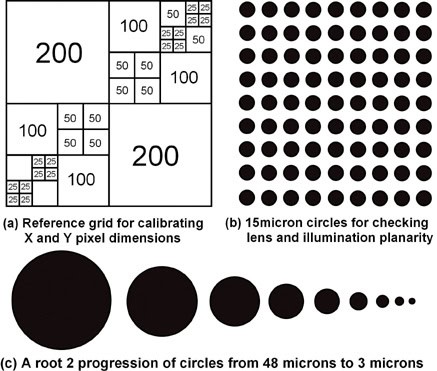 |
| Figure 2. The NPL Image Analysis Reference Graticule |
In addition the aspect ratio of the pixel array in the CCD camera needs to be known, otherwise any distortion could be falsely attributed to the particle shape. Some detectors have been found to have differences of up to 10% between the X and Y directions. As particles decrease in size other factors such as focusing, edge detection and diffractional enlargement (an aberration based on physical size) also need to be considered. These factors could easily add a further 10% uncertainty in the measurement.
The calibration starting point is the National Physical Laboratory stage reference graticule. There are several very useful fields on this graticule that are invaluable to image analysis, figure 2. Firstly, the certified grid must be used for correcting any pixel array distortion, figure 2a. Dependent on the magnification being used, an appropriate square grid should fill the field of view and the X and Y dimensions compared.
Having made any necessary axial compensation, the calibration of each lens can begin. Either the NPL or a National Institute of Standards and Technology (USA) graticules may be used. The uniformity of the illumination source and the planarity of the lenses may be checked using the array of 15 micron spots, figure 2b. Any deviation from the certified values indicates poor quality lenses or uneven illumination.
Finally for sizes from 48 microns down to 3 microns, there is a root 2 array of certified spots, figure 2c. These are especially useful for setting the threshold or the exact shade of grey that corresponds to the particle edge. Usually, for spots down to about 11 microns, there will be good correlation using the calibration from the large grid or linear scale, but below 10 microns, allowances must be made for other factors intruding on the calibration, for example particle enlargement by edge diffraction or thresholding issues mentioned above.
The final check on the calibration of the image analyser, especially when working at high magnifications, is to use NIST traceable latex standards. Unlike the 2-dimensional spots on the NPL graticule, latex standards are 3-dimensional and so are a better model for particles being measured by microscopy.
Illumination, focussing and thresholding issues can then be resolved and calibration corrections can be applied if necessary. However, it is important to know the range within which a modified calibration must be applied otherwise the accuracy of the dynamic range of an analysis could be compromised.
 |
| Figure 3. An image analysis reference standard for measuring resolution |
Shape analysis has been important in the diamond abrasive industry for many years. One application for high quality abrasive pastes has been in producing satellite photographic lenses. To get to the penultimate polishing stage of a convex lens could have cost over £50,000, in addition if the diamond used on the final polish has particles with large aspect ratios, these shards would scratch the surface and all the good work needed to get a lens to that stage.
Image analysis can quantify the 'out of shape' component of an industrial diamond powder so that it can be removed and reprocessed before it can do any harm, figure 4.
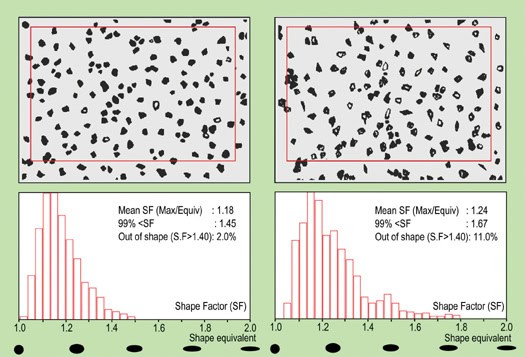 |
| Figure 4. Quantifying shape analysis of an industrial diamond |
As particle size distributions increase however, a larger number of particles need to be counted to obtain statistically robust data. This presents a problem not just in obtaining representative samples but in preparing slides for analysis, which can be very labour intensive. For example, the Bureau of Certified Reference in Brussels recommended a particle count of at least 6500 for the particle size distributions of 10:1 in their reference standards.
As many industrial powders have size distributions of 100:1, an even greater particle count is required, especially if the extremes of the distributions are important. Once particle counts exceed about 10,000, conventional microscopy no longer becomes an option and some form of automated image analysis system must be employed.
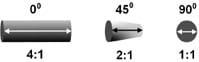 |
| Figure 5. Rotating a rod out of the measuring plane can produce a range of aspect ratios when measuring in 2-dimensions |
In the case of asbestos fibres, for example, the fibres are essentially circular in cross section so provided they are constrained between microscope slide and cover slip, they are always in a good orientation for measurement. Similarly, if the particles are orientated in a liquid flow field for continuous analysis, accurate length to diameter ratios can be obtained.
However a problem arises when trying to analyse a random orientation of fibres, for example when they are dropped or carried in an air current through the measuring zone. A single rod can have an infinite number of 2-dimensional sizes from the end-on cross section to the maximum rod length (figure 5) so a false range of shapes could be reported.
To be sure that elongated particles are not measured at oblique angles the only real solution is three-dimensional microscopy.
An interesting example where the knowledge of three dimensions is really important, is the manufacture of whiskey, the highest quality product comes from 'fat bellied' grain and it is the second of the three-dimensional sizes that determines the taste. Consequently, bonuses are paid on the basis of the shape of the barley. There is therefore much dispute after harvest concerning the shape content of the crop.
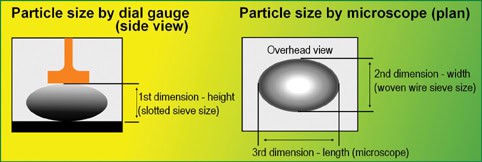 |
| Figure 6. The first dimension or thickness of a particle can be difficult to determine by microscopy |
Being able to measure two dimensions is certainly an improvement over other methods that only measure the equivalent spherical diameter but it still does not solve the problem in that the vital first dimension still cannot be measured.
Recent developments in three-dimensional microscopy can scan particles at different depths of focus to provide a contour of the surface, but it is still not possible to see underneath a particle 'overhang'.
Techniques borrowed from clinical imaging such as CAT scanning (Computer Axial Tomography) are able to produce 3-D images but even the best tasting whiskey could not absorb such an expensive analytical technique! In principle, microscopy with image analysis is an easy to understand method of particle size analysis, after all 'seeing is believing'. However, we all know the doubts cast on that other old adage 'the camera never lies'.
In practice, the technique can be difficult to implement because of the large number of uncertainties associated with the various elements of the system. Nevertheless, if all the areas of calibration are rigorously observed, the technique is an un-paralleled tool for detailed analysis in particle metrology.
It is for this reason that all the major manufactures of particle analysers have now added image analysers to their range. So far the methods analyse mostly in two-dimensions, but with increasing computer and imaging power we can expect the expensive 3-D techniques currently being used in health care to find their way into particle metrology laboratories.
 By Dr Graham Rideal. Dr Rideal is the founder and managing director of Whitehouse Scientific. His laboratory was selected by the Bureau of Certified Reference as one of the top five European certification laboratories for Microscopy and Image Analysis.
Related Content

Siemens recognition for Bürkert enables improved development
Fluid control specialist Bürkert has become an official Siemens Product Partner for Siemen’s SIMATIC Automation Systems. The new partnership will …

Innovation in dialysis equipment
In 2022, more than 30,000 people were undergoing kidney dialysis in the UK [1], all of whom will require precision …

Liebherr launches new under-bench fridge and freezers for lab and healthcare providers
Liebherr, specialists in commercial refrigeration, have introduced its new range of under-bench fridges and freezers, engineered to meet the diverse …