Playing the numbers game
In modern drug discovery the key is to extract the gold from your screening mountain and turn your Database into a usable Knowledgebase.
In modern drug discovery the key is to extract the gold from your screening mountain and turn your Database into a usable Knowledgebase.
"Drug Discovery requires passion, commitment and often serendipity – it's not a mechanical event, it's not numbers driven, it's a personal experience!"1. So says Dr Simon Campbell, CBE, President of the Royal Society of Chemistry. He should know. Dr Campbell played a key role in the discovery of three successful drugs: doxazosin (Cardura), amlodipine (Norvasc) and sildenafil (Viagra).
| ||||||
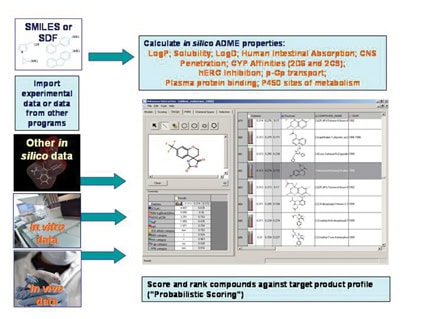
| Figure 1: Admensa Interactive; Comprehensive data analysis in an intuitive probabilistic scoring framework, working with in silico, in vitro and in vivo data in a single package. |
Compound databases are vital to the effective capturing of the vast amounts of screening data now being collected. Unfortunately, databases have to be more than data stores; they must be both a knowledge base for the sharing and communication of results and a user interface which facilitates data manipulation - i.e. where the numbers and the personal experience are brought together. Without such a meeting, data remain data, no matter how extensive the collection. The value is only released when the data can be used to make effective decisions.
A common problem is that database architects, data generators and data miners are different people and whilst putting results in is usually easy, subsequent retrieval and manipulation of the data is not. Apart from straightforward missing values, data is often lost for processing by the data miner due to the inclusion of "illegal" text characters, inconsistent recording of values or simply typographical errors. Another problem is that of data paucity due to employment of a screening Cascade - where some properties are only measured for a compound if it passes the criteria set for some earlier tests in the cascade. Such gaps can be frustrating when trying to make a balanced judgment across multiple properties as it is unreasonable to make judgments on a key property for which less than 80% of compounds have values, or to make judgments on a compound for which less than 80% of the key property values have been measured.
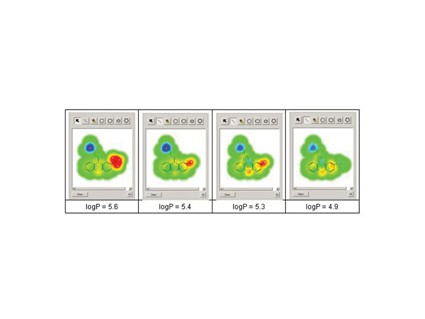 |
| Figure 2: Glowing Molecule; Highlighting the structural features which contribute the positive and negative attributes for any property. Example shown is for calculated logP as a structure is modified using the Admensa InteactiveTM design tool. |
There is clear need for an interface which will deal with drug discovery project data of varying accuracy, from disparate sources (in silico, in vitro, in vivo), in an interactive and intuitive manner, using appropriate visualisation tools. One interface which meets these demands is Admensa Interative, which is outlined in Figure 1. The basic package includes a suite of high quality in silico models for the prediction of a number of key ADME properties and was primarily intended to help the medicinal chemist reduce potential liabilities in these areas when choosing or designing compounds against a therapeutic target.
Amongst the helpful visualisation tools is "Glowing Molecule" that shows the user which areas of a structure contribute the positive and negative attributes for any property being assessed. Figure 2 shows this in action for calculated logP. The user can also build models using their own data and the interface will automatically apply multiple, advanced modelling techniques to identify those most appropriate to the data. But the question of model performance always arises with in silico predictions and it is important that the user is told the level of any uncertainty associated with a predicted value.
The interface was designed with this concern in mind and probabilistic scoring algorithms have been incorporated5 which allow the user to rank compounds not only on the basis of the predicted values, but also on the confidence in that value. This same system can be applied to any data and the interface can be configured to accept files from a variety of sources, and work with measured or predicted data to prioritise compounds across all properties – provided that a value or estimate of the uncertainty is provided for each data value.
A key consideration in compound prioritisation is not only how well a molecule performs in the test for any property, but also the relative importance of each of these tests. The list of priorities is usually governed by the Target Product Profile (TPP) - i.e. what are the "must haves" and what are the "nice to haves" which will ensure that a molecule becomes a successful drug. Usually, the TPP is reflected in the screening cascade as described above but, as noted, this means that data may be scarce from some lower ranked screens and compounds which may have been outstanding in these properties may be penalised through lack of data because of a mediocre performance in a single test. With systems like Probabilistic Scoring, this risk can be attenuated to a degree by assigning an average score to compounds for a missing property value, but giving this value a high level of uncertainty. In this way compounds which might have done well against the TPP if fully tested are flagged up for further investigation.
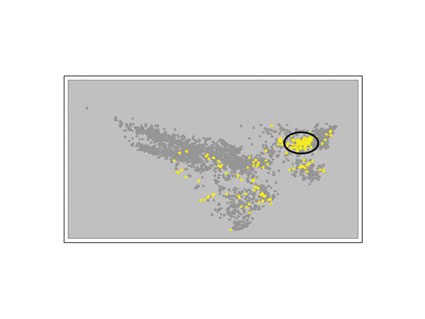 |
| Figure 3: "Chemical Space: In this illustration, approximately 3,000 compounds have been tested for target potency (grey dots) but a limited diversity has been tested for ADME properties (yellow dots). Due to high target potency in the area circled, testing has largely focused on a narrow range of structures, leaving a large area of chemistry unexplored, where a more appropriate balance of properties for the Target Product Profile might exist. |
References
1. Simon Campbell (August 2006), Nature Reviews Drug Discovery: 5, 626.
2. Beresford AP, McGibney D, Humphrey MJ, Macrae PV and Stopher DA., (1988), Xenobiotica: 18, 245-254.
3. Keith Saunders and the High Throughput ADME Team, Pfizer Global R&D., (September 2006), poster presentation, SBS Advancing Drug Discovery Conference, Seattle, WA.
4. Scott D Mosser, Merck West Point (August 2006), poster presentation, Drug Discovery Technology Conference, Boston, MA.
5. Segall MD, Beresford AP, Gola JMR, Hawksley D and Tarbit MH. (2006), Expert Opin. Drug Metab. Toxicol, 2, 325-337.
 Alan Beresford, PhD, is a Senior Research Fellow in the ADMET group of BioFocus DPI. Alan has some 30 years experience in Drug Discovery, both with major pharmaceutical companies and in the Biotech arena; bringing together computational and experimental approaches to ensure appropriate property balance in drug candidate molecules.
Related Content

Siemens recognition for Bürkert enables improved development
Fluid control specialist Bürkert has become an official Siemens Product Partner for Siemen’s SIMATIC Automation Systems. The new partnership will …

Innovation in dialysis equipment
In 2022, more than 30,000 people were undergoing kidney dialysis in the UK [1], all of whom will require precision …

Liebherr launches new under-bench fridge and freezers for lab and healthcare providers
Liebherr, specialists in commercial refrigeration, have introduced its new range of under-bench fridges and freezers, engineered to meet the diverse …